Welcome to the ultimate deep dive into making money online in the stock market! Whether you’re a complete beginner eager to understand the fundamentals or an experienced trader looking to refine your strategies, this comprehensive post unpacks the essential concepts and techniques you need to navigate the dynamic world of stock investing from your digital workspace. Consider this your in-depth preview of the valuable knowledge contained within our book, “50 Breakout Stocks: Make Money Online in the Stock Market,” crafted to empower you on your journey toward achieving your financial goals through online investing. Let’s embark on this detailed exploration!
Before we dive into the specifics of stock market investing and breakout strategies, it’s crucial to have a solid foundation in money management. If you’re new to handling your finances or want to brush up on the basics of budgeting, saving, and investing in the Indian context, we highly recommend reading our blog page: “Beginner’s Guide to Financial Planning in India: Budgeting, Saving, Investing & More“. Building a strong financial base will complement your stock market endeavors.
Concept of Making Money in Stocks
- The Magic of Compounding: Compounding is the process where the earnings from an investment are reinvested to generate additional earnings. Think of it as earning interest on your initial investment and on the accumulated interest. Over time, this exponential growth can significantly increase your wealth. For instance, if you invest ₹10,000 at a 10% annual return, in the first year you earn ₹1,000. In the second year, you earn 10% on ₹11,000 (your initial ₹10,000 + ₹1,000 earned), which is ₹1,100, and so on. The longer you let your investments compound, the more powerful this effect becomes.
- The Rule of 72: A Quick Way to See Your Money Double: This is a handy mental math trick to estimate the number of years it will take for your investment to double. You simply divide 72 by the annual rate of return. For example, if your investment is expected to grow at 8% per year, it will roughly take 72 / 8 = 9 years to double. Keep in mind this is an estimate, but it provides a quick understanding of the time horizon for doubling your money.
- How Compounding Really Works: Let’s illustrate with an example. Suppose you invest ₹50,000 with an average annual return of 12%. After 10 years, with simple interest, you would have earned ₹60,000 (₹5,000 per year). However, with compounding, the interest earned each year also starts earning interest. Over 10 years, your ₹50,000 could potentially grow to over ₹155,000! This stark difference highlights the significant advantage of compounding in long-term wealth building.
- Real-Life Examples of Investment Growth: Consider two individuals: Aisha starts investing ₹5,000 per month at age 25, earning an average annual return of 9%. Ben starts the same at age 35. By age 60, Aisha’s total investment would be ₹2.1 million, potentially growing to a significantly larger sum due to the longer compounding period. Ben, even if he invests more per month, might end up with less due to the lost years of compounding. These examples underscore the importance of starting early and staying consistent.
- Stock Market vs. Fixed Deposits (FDs): Fixed Deposits offer a fixed rate of return and are considered low-risk. However, their returns typically lag behind the potential returns of the stock market over the long term. While the stock market involves higher volatility and risk, it also offers the opportunity for significantly greater growth, especially when considering the power of compounding on potentially higher average returns. The choice depends on your risk appetite and investment goals.
Understanding the Language of Charts
- Logarithmic vs. Arithmetic Charts: An arithmetic chart displays price movements on a linear scale, where equal price changes are represented by equal vertical distances. A logarithmic chart, on the other hand, displays price changes proportionally. This means equal percentage changes are represented by equal vertical distances. Logarithmic charts are particularly useful for analyzing long-term trends and high-growth stocks, as they provide a clearer picture of percentage gains rather than absolute price changes.
- Fundamental Analysis: Knowing What You Own: This involves evaluating a company’s intrinsic value by examining its financial statements (revenue, profits, debt), management, industry position, competitive landscape, and the overall economic environment. The goal is to determine if a stock is undervalued or overvalued. Key metrics include price-to-earnings ratio (P/E), earnings per share (EPS), debt-to-equity ratio, and revenue growth.
- Technical Analysis: Reading the Price Action: Technical analysts believe that all known information is reflected in a stock’s price and trading volume. They study historical price patterns, trends, and indicators to forecast future price movements. Unlike fundamental analysis, technical analysis focuses on the “how” of price movement rather than the “why.”
- Support and Resistance: Price Boundaries: Support levels are price points where buying pressure is strong enough to prevent the price from falling further. Resistance levels are price points where selling pressure is strong enough to prevent the price from rising higher. These levels are often formed by previous highs and lows and represent areas of significant buying or selling interest.
- Trend Lines: Following the Direction: Trend lines are straight lines drawn on a price chart to connect a series of highs (downtrend) or lows (uptrend). They help visualize the direction and strength of a trend. A rising trend line connects a series of higher lows, indicating an uptrend, while a falling trend line connects a series of lower highs, indicating a downtrend.
- Trendline Slope and its Importance: The slope of a trend line can indicate the momentum of a trend. A steep trend line suggests a strong, rapid trend, which may be less sustainable. A more gradual slope indicates a healthier, more sustainable trend. Breaking a trend line can signal a potential change in the prevailing trend.
- Moving Averages: Smoothing Out the Noise: A moving average (MA) is a calculation used to analyze data points by creating a series of averages of different subsets of the full data set. In stock charts, moving averages smooth out short-term price fluctuations, making it easier to identify the underlying trend. Common periods for moving averages include 20-day, 50-day, and 200-day.
- Exponential Moving Average (EMA): Giving More Weight to Recent Data: Unlike a simple moving average (SMA), which gives equal weight to all data points in the period, an Exponential Moving Average (EMA) gives more weight to the most recent prices. This makes the EMA more responsive to recent price changes and potentially a better indicator for shorter-term trading strategies.
- Identifying Trends with Moving Averages: Traders often use the relationship between price and moving averages, as well as the crossover of different period moving averages, to identify trends. For example, when the price is consistently above a long-term moving average (like the 200-day), it suggests an uptrend. A crossover of a shorter-term MA above a longer-term MA (a “golden cross”) can also signal the start of an uptrend.
- Price Action: What the Candles Tell You: Candlestick charts provide a visual representation of the open, high, low, and closing prices for a specific period. The color of the candle (typically green or white for a higher close than open, and red or black for a lower close) and the length of the body and wicks (the lines extending above and below the body) provide insights into the buying and selling pressure during that period.
- Breakouts: When Prices Make a Run: A breakout occurs when the price of a stock moves decisively above a significant resistance level or below a significant support level. Breakouts often signal the start of a new trend or a continuation of an existing one with increased momentum.
- Breakout Trading: Catching the Momentum: Breakout trading involves identifying potential breakout levels and entering a trade once the price confirms the breakout. Traders often look for increased volume during a breakout to confirm its validity. The goal is to profit from the strong price move that often follows a breakout.
- Fakeouts: Avoiding the False Moves: A fakeout, or false breakout, occurs when the price briefly moves above resistance or below support but then quickly reverses direction. These can trap traders who entered on the initial move. Looking for strong volume confirmation and waiting for the price to hold above the breakout level can help avoid fakeouts.
- Long Term Investment: Riding the Big Trends: Technical analysis isn’t just for short-term trading. Long-term investors can use trend lines, long-term moving averages (like the 200-week MA), and major chart patterns on weekly and monthly charts to identify long-term trends and potential entry points for long-term holdings.
- Multi Time Frame Analysis: Getting the Bigger Picture: Analyzing a stock on multiple timeframes (e.g., looking at a monthly chart for the overall trend, a weekly chart for intermediate patterns, and a daily chart for entry points) can provide a more comprehensive understanding of the stock’s price action and help align short-term trades with the longer-term trend.
- Fibonacci Retracements: Finding Potential Reversal Zones: Fibonacci retracement levels are horizontal lines drawn on a chart to identify potential support or resistance levels. They are based on the Fibonacci sequence and the golden ratio (approximately 61.8%). Traders often watch for price reversals near these levels after a significant price move. Common retracement levels include 23.6%, 38.2%, 50%, 61.8%, and 78.6%.
- Golden Ratio: Finding Stock “Bounce Zones” with Fibonacci: The 61.8% Fibonacci retracement level is particularly significant and is often considered a key area of potential support during an uptrend or resistance during a downtrend. Many traders look for buying opportunities when the price pulls back to this level during an uptrend.
- Fibonacci Extension: Projecting Profit Targets: Fibonacci extension levels are used to project potential price targets after a significant price move and a subsequent retracement. Common extension levels include 127.2%, 161.8%, and 261.8%. Traders often look to take profits near these levels.
Understanding Market Rhythms
- Four Stock Market Cycles: The stock market tends to move in cyclical patterns influenced by economic conditions, investor sentiment, and other factors. Understanding these cycles can help investors make more informed decisions.
- Accumulation Phase (Spring): This phase typically occurs after a downtrend. Smart money (institutional investors) starts buying as valuations become attractive, but general public sentiment remains bearish or neutral. Price movements are often sideways or show a gradual upward drift.
- Uptrend Phase (Summer): As the economy improves and company earnings rise, more investors start buying, leading to a sustained period of rising stock prices. Bullish sentiment grows, and breakouts become more common.
- Distribution Phase (Autumn): This phase occurs as the market reaches a peak. Smart money starts selling their holdings as valuations become stretched and concerns about the future emerge. Price action can become volatile with sideways movement before a potential reversal.
- Downtrend Phase (Winter): A period of falling stock prices driven by negative economic news, declining earnings, and bearish investor sentiment. Support levels are often broken, and fear dominates the market.
- Big Investors, Big Moves: Trading the Market Cycle: Institutional investors with large amounts of capital can significantly influence market movements, especially during the different phases of a market cycle. Identifying their likely actions based on the current phase can provide valuable insights for individual traders.
- Riding the Big Wave: Trading with the Smart Money: Strategies involve looking for clues that indicate institutional buying or selling, such as high volume breakouts during accumulation or distribution phases. Aligning your trades with the likely direction of smart money can increase the probability of success.
- Exiting with the Smart Money: Knowing When to Take Profits: Recognizing signs of potential distribution, such as decreasing volume on rallies or increased volatility near highs, can signal that smart money is starting to take profits and might be a cue for individual investors to do the same.
Spotting Profitable Patterns
- Types of Chart Patterns: Chart patterns are recognizable formations on price charts that can provide insights into potential future price movements. They are based on the psychology of buyers and sellers.
- Continuation Patterns: These patterns suggest that the prevailing trend is likely to resume after a period of consolidation. Examples include:
- Flags and Pennants: Short-term consolidation patterns that slope against the main trend.
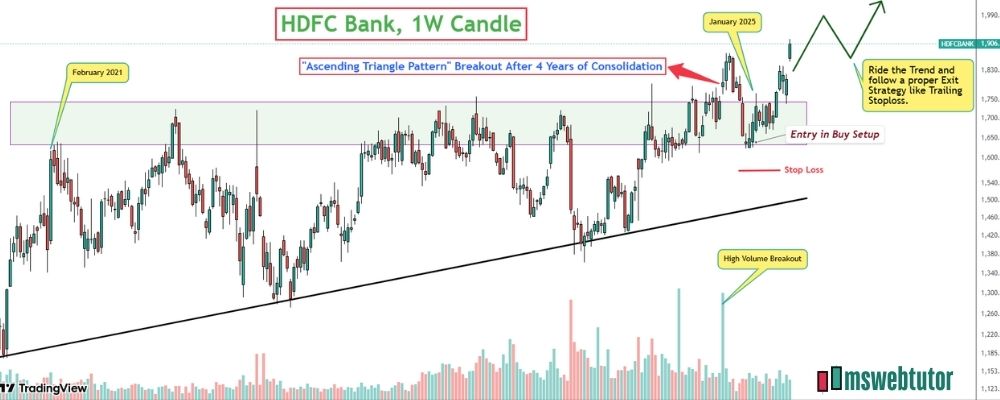
- Triangles (Symmetrical, Ascending, Descending): Patterns that show a narrowing price range, often leading to a breakout in the direction of the prior trend.
- Reversal Patterns: These patterns can indicate a potential change in the direction of the current trend. Examples include:
- Head and Shoulders (Top and Bottom): Major reversal patterns with a peak (or trough) flanked by two smaller peaks (or troughs).
- Double Tops and Bottoms: Patterns indicating failure to break above a high (or below a low) twice, often leading to a reversal.
- Breakout Trading Strategy with Chart Patterns: Combining the identification of these chart patterns with breakout trading involves waiting for the price to break out of the pattern’s boundaries with strong volume to initiate a trade in the direction of the breakout. The measured move of the pattern can often provide potential profit targets.
Protecting Your Capital
- Risk-Reward Ratio: Gauging Your Potential Profit vs. Loss: This ratio compares the potential profit of a trade to its potential loss. It’s calculated as (Potential Profit) / (Potential Loss). A ratio greater than 1:1 is generally desirable, meaning you stand to gain more than you risk.
- Risk-Reward and Emotion: Staying Calm Under Pressure: Emotional trading, driven by fear or greed, can lead to abandoning your risk-reward strategy. Sticking to your pre-defined plan, including stop-loss orders and profit targets, is crucial for disciplined trading.
- The Power of Risk-Reward (Secret to Profit): Even with a win rate slightly below 50%, consistently adhering to trades with a favorable risk-reward ratio (e.g., 2:1 or 3:1) can lead to overall profitability in the long run.
- Position Sizing: Investing Smartly Based on Risk: This involves determining the appropriate amount of capital to allocate to a trade based on your total capital and the risk you’re willing to take. A common rule is to risk no more than 1-2% of your trading capital on any single trade.
- Entry & Exit Strategy: Planning Your Moves: Having a clear entry strategy (the specific conditions under which you will enter a trade) and an exit strategy (conditions for taking profits or cutting losses) is essential for disciplined trading.
- Entry Strategies:
- Breakout & Buy Setup Entry: Entering on a confirmed breakout above resistance or below support, or waiting for a pullback (buy setup) to a former resistance level that now acts as support.
- Buying the Bottom: Entering Before the Breakout: Identifying stocks showing signs of accumulation near support within a potential breakout pattern and entering a position before the actual breakout occurs.
- Trendline Support Entry: Initiating a long position when the price bounces off a well-established rising trend line, indicating continued buying interest.
- Entry Using Moving Averages: Buying when the price pulls back to a key moving average (like the 50-day EMA) during an uptrend, using the moving average as dynamic support.
- Entry Using Fibonacci Retracement: Entering a long position at key Fibonacci retracement levels (like the 61.8% level) during a pullback in an uptrend, anticipating a bounce.
- 61.8% Fibonacci Level Significance: This level is often considered a high-probability reversal zone during a retracement.
- Trading Fakeouts: Entering a trade in the opposite direction of a false breakout after the price reverses back within the previous range.
- Exit Strategies:
- Breakdown Exit: Selling a long position when the price breaks decisively below a key support level, signaling a potential downtrend.
- Exiting at Resistance: Taking profits when the price reaches a significant resistance level, anticipating a potential pullback.
- Exit Using Moving Averages: Selling a long position when the price closes below a key moving average during an uptrend, indicating potential trend weakness.
- Exit Using Fibonacci Extension: Taking profits at potential price targets identified by Fibonacci extension levels after a significant price move.
- 161.8% Fibonacci Level Significance: This is often considered a key Fibonacci extension level where significant profit-taking might occur.
- Exiting at Pattern Height: Using the measured move of a chart pattern (the height of the pattern projected from the breakout point) to set a profit target.
- Beyond Pattern Height: Riding the Trend: Using trailing stop-loss orders or other trend-following indicators to stay in a profitable trade beyond the initial pattern target.
- Using Trailing Stop-Loss to Protect Profits: Setting a stop-loss order that moves with the price as it goes up, locking in profits while allowing for further gains.
- Exiting Flag & Pole Patterns: Specific techniques for setting profit targets and stop-losses based on the structure of flag and pole continuation patterns.
- False Breakout Exit Strategy: Quickly exiting a trade if the anticipated breakout fails and the price reverses significantly.
Finding Potential Winners
- 50 Breakout Stocks List: This section will present a curated list of 50 stocks that, based on recent chart analysis, exhibit strong potential for upward movement due to breakout patterns or are setting up for such breakouts. For each stock, you will typically find:
- A visual representation (chart image) of the specific breakout pattern identified. This allows you to see the technical setup.
- A suggested entry strategy, outlining potential price levels or conditions to consider when initiating a trade. This might include buying on the confirmed breakout, on a pullback to support, or near a key moving average.
- A suggested exit strategy for a longer-term perspective, providing guidance on where to potentially take profits or manage your exit based on long-term technical indicators, key resistance levels, or the overall trend following the breakout. This aims to provide a framework for holding the stock for a more extended period to maximize potential gains from the breakout momentum.
- Important Considerations: These breakout stocks may offer good opportunities to invest in momentum stocks. Remember to conduct your own thorough analysis on 10-20 selected stocks from this list before investing. Avoid investing in all 50 to maintain manageable diversification and tracking. If you miss initial entries, look for buy setups on retests or entries during uptrend rallies near moving averages. Always prioritize your own analysis and sound risk management. Be aware that these patterns are based on recent data and may evolve; stay updated for future versions of this post.
Example Entry & Exit: Bajaj Finance Pattern Breakout

Want the full list? Download the digital copy of the book to get all 50 breakout stock picks with their corresponding chart images. (Contact-Us)
Disclaimer: This blog page provides general information on personal finance for educational purposes only. It is not intended as financial advice. Please consult a qualified financial advisor for advice tailored to your specific situation. You can find our full disclaimer page here.